For those of you that read In-Process Testing in a Production Environment blog, this is the second installment in the series.
Anyone who works in manufacturing understands the criticality of measuring the performance of sub-assemblies and finished products on a production line — and that’s where in-process testing comes into play.
In my last post, I briefly covered how Optikos employs in-process testing using various techniques in the manufacturing process. Performing in-process testing is neither the beginning nor the end of quality monitoring on a production floor. Effective in-process testing starts before components even get to the production floor.
Catching defects in manufacturing is critical to having a low yield of failed assemblies. However, finding these defects during the build process is never ideal. Mid-process defects can lead to rework, scrap, and an overall inefficient build process, increasing time and cost and lowering the overall quality of the build.
So, how do we prevent these mid-build defects from consuming our manufacturing process?
One word: Inspection.
Incoming Inspection
Incoming inspection is the first quality gate for components coming onto the manufacturing floor. And thorough inspection is critical. But how thorough is thorough enough in regards to incoming inspection? There’s more to review than just the parts— we have to consider the overall process, time, and resources needed for thorough inspection. For example, does every component in a lot need to be inspected to all of its dimensions? Do we have the resources or funding to even tackle that level of inspection? At Optikos we use a C=0 AQL inspection process to determine the quantities in a lot that need to be inspected. C=0 refers to what we do if we find a defect. A C=0 inspection plan means that if we find one defect within our AQL sampling we either perform 100% inspection on the lot or reject the lot. At Optikos we perform a 1.0 or 4.0 AQL depending on the criticality of the part The AQL is an indication of the number of parts to be inspected within a given lot size. Though we generally choose 1.0 or 4.0 we can set other AQLs as needed.
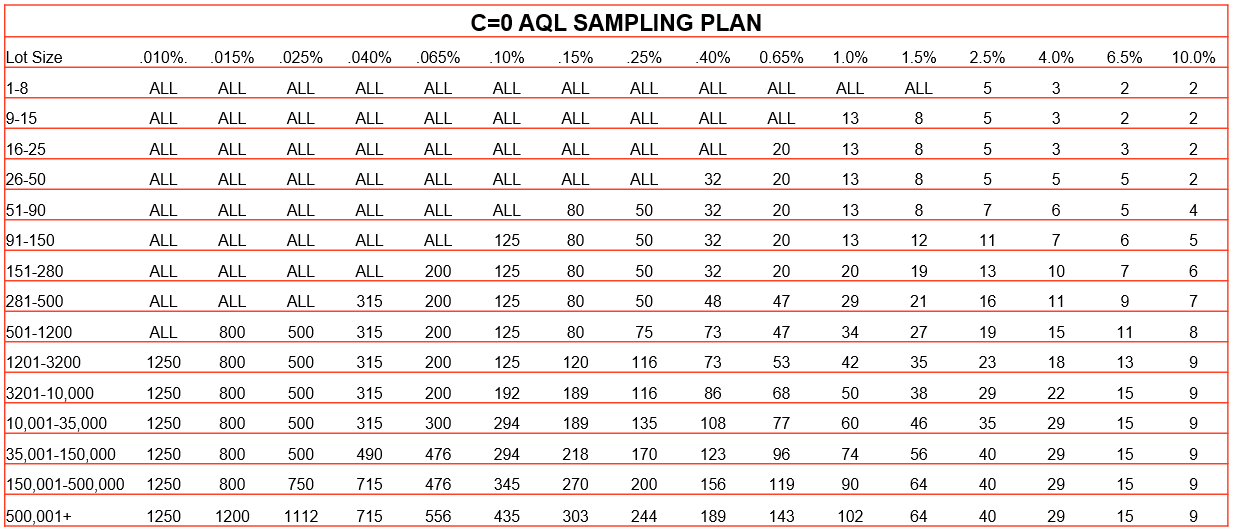
By implementing a C=0 AQL process, our inspection process improves efficiency by focusing additional resources only on lots that have shown some level of non-conformance without the need to check every single part of every single lot.
Once components have passed incoming inspection, they are moved onto the assembly floor where they are built into assemblies. This is where our in-process testing occurs.
Visualizing In-Process Testing
During our in-process testing, we do not simply take data, determine pass or fail, and move on. Instead, our manufacturing teams constantly monitor collected data to spot and analyze trends or sudden changes that could indicate a change or a problem on the assembly line.
An example of our data set is shown below. In this manufacturing process, we use an automated, robotic system to test large batches of lenses on our LensCheckTM systems for On-and-Off Axis MTF (imaging performance) and focal length. As testing occurs, testing data passes through from our systems into this dashboard, immediately populating with results of large test batches to help us determine these critical trends and changes in the manufacturing process.
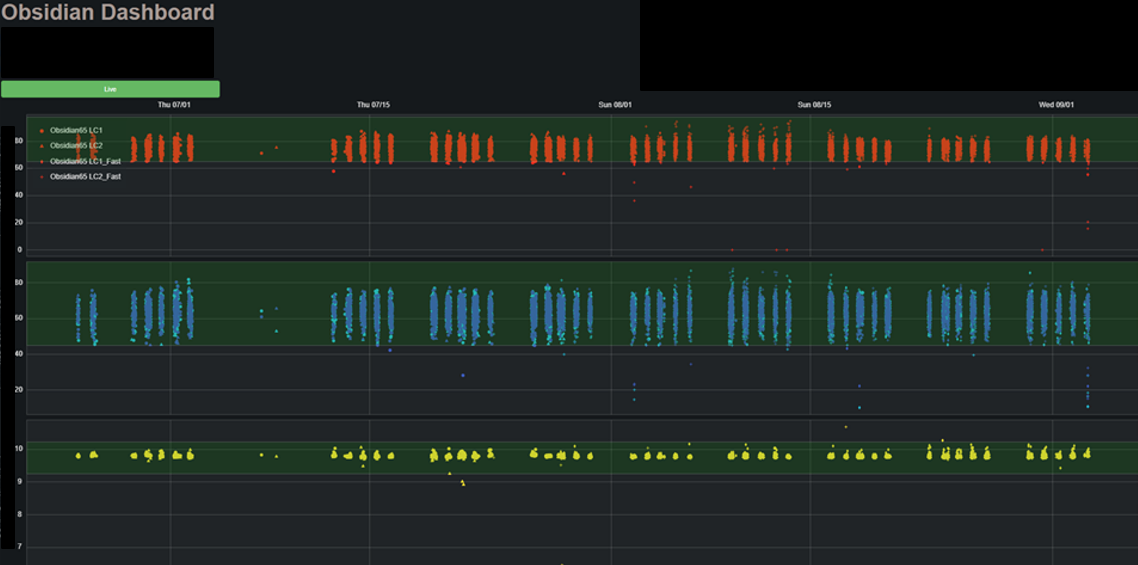
By constantly monitoring this information, we can quickly visualize the data as it’s collected. In the event of a sudden change in performance results, our engineering and manufacturing teams can quickly identify areas in our assembly process that require further investigation before we suffer a major loss of ineffective or failed parts. Similarly, if we are seeing a trend of performance output we can quickly identify the trend and investigate the root cause.
Putting the Pareto Principle to Work
To constantly improve our manufacturing processes, there are other statistical techniques we employ to identify areas to focus on. Specifically, a Pareto analysis can be done on the manufacturing process to identify the most frequent failure modes. Pareto may sound familiar to readers as the “80/20” rule – in this case, it’s when 80% of the problem can be traced to 20% of the causes; or, that most of our defects are likely arising from a handful of issues in the manufacturing process.
In the example below, Optikos was building a sub-assembly for a customer in the quantity of 1,000s of units per year. The units we delivered were failing at a higher assembly level of their build process. We looked at all the units they sent back to us and identified the various failure modes. By plotting in a Pareto chart, we quickly deduced where we should focus our efforts for improved manufacturing efficiency. The reasons have been sanitized for confidentiality purposes, but you can see that the first three of eight failure modes account for over 80% of the failures.
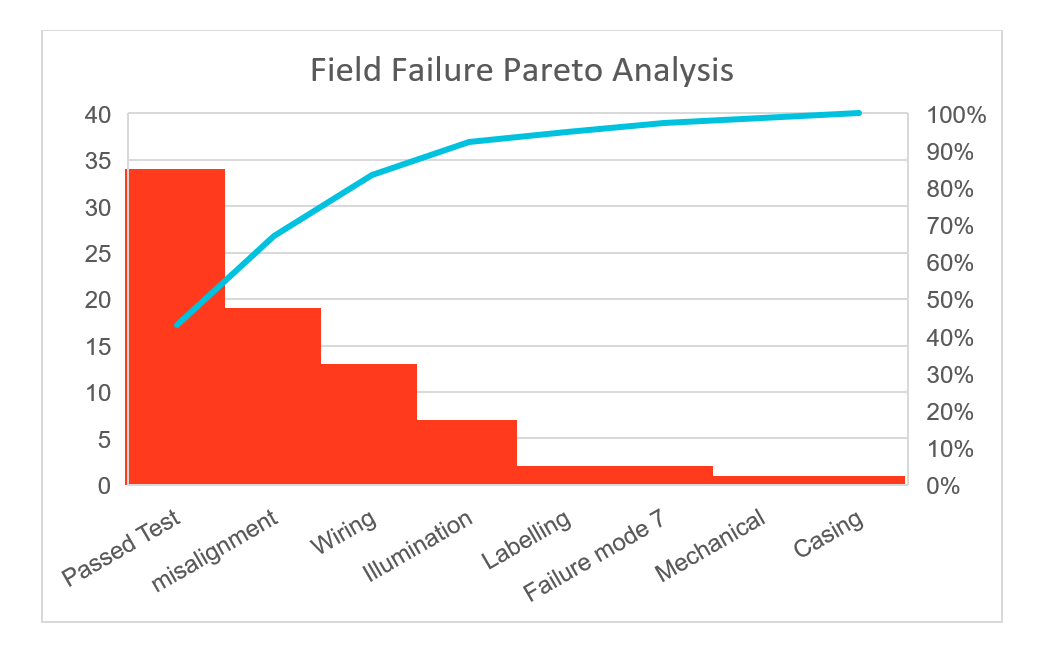
Once the most common failure modes were identified, further root cause analysis was performed to mitigate the failure mode and improve yield and overall touch time. In the case above we were able to identify several issues to address the majority of the failures:
- 1. Our assembly’s specification and functional test were not reflective of how our customer was using the product in the higher-level assembly. This helped our customer in their root cause analysis by showing which of our units were performing as expected in their failing higher-level assemblies.
- 2. We identified when/where misalignments were occurring and determined mitigation steps, which included additional handling and inspection processes.
- 3. We identified when/where wiring issues were occurring and determined mitigation steps, which included additional handling and inspection processes.
This is just a sample of how we use statistical techniques to improve our efficiency and quality in our manufacturing department at Optikos. For more information about manufacturing at Optikos visit our manufacturing page, or reach out to our teams directly for a build-to-print quote.
Not sure if your project is ready for build-to-print? Review our Manufacturing Readiness Checklist to gauge the build-to-print readiness of your product.

